
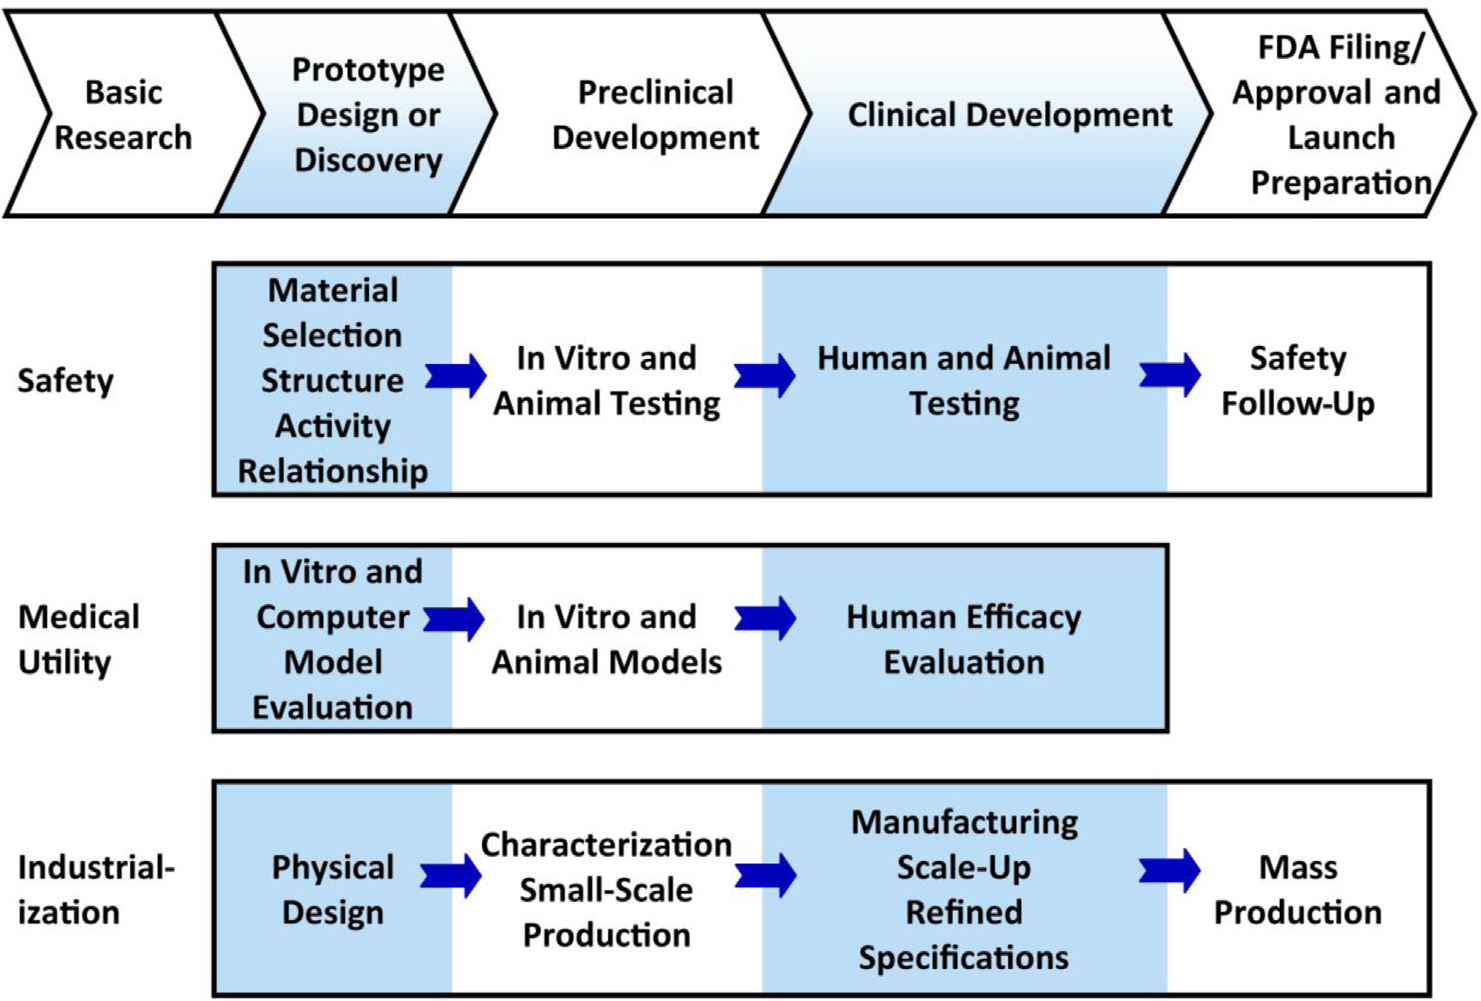
DESCRIPTION
AN OVERVIEW OF THE
PRODUCT DEVELOPMENT PATHWAY.
This figure represents a highly generalized description of activities involving FDA-regulated product development that must be successfully completed at different points. The FDA describes three interdependent subgroups (safety, medical utility, and industrialization) of the general pathway to approval with efficiencies gained in these three subgroups affecting the overall expense and timeline to approval. In summary, development can be conceptualized as a process leading from basic research through a series of developmental steps to a commercial product. Many of the activities involving product development are highly complex and whole industries are devoted to supporting them. Not all are performed for every candidate and many activities are omitted from the figure. If the product being developed is a drug, then first a candidate drug emerges from a drug discovery program. Then, the candidate must successfully complete a series of evaluations of its potential safety and efficacy and must be amenable to mass production. For each candidate finishing the pathway, thousands of candidates are evaluated in the discovery phase. (Figure adapted from the FDA.)
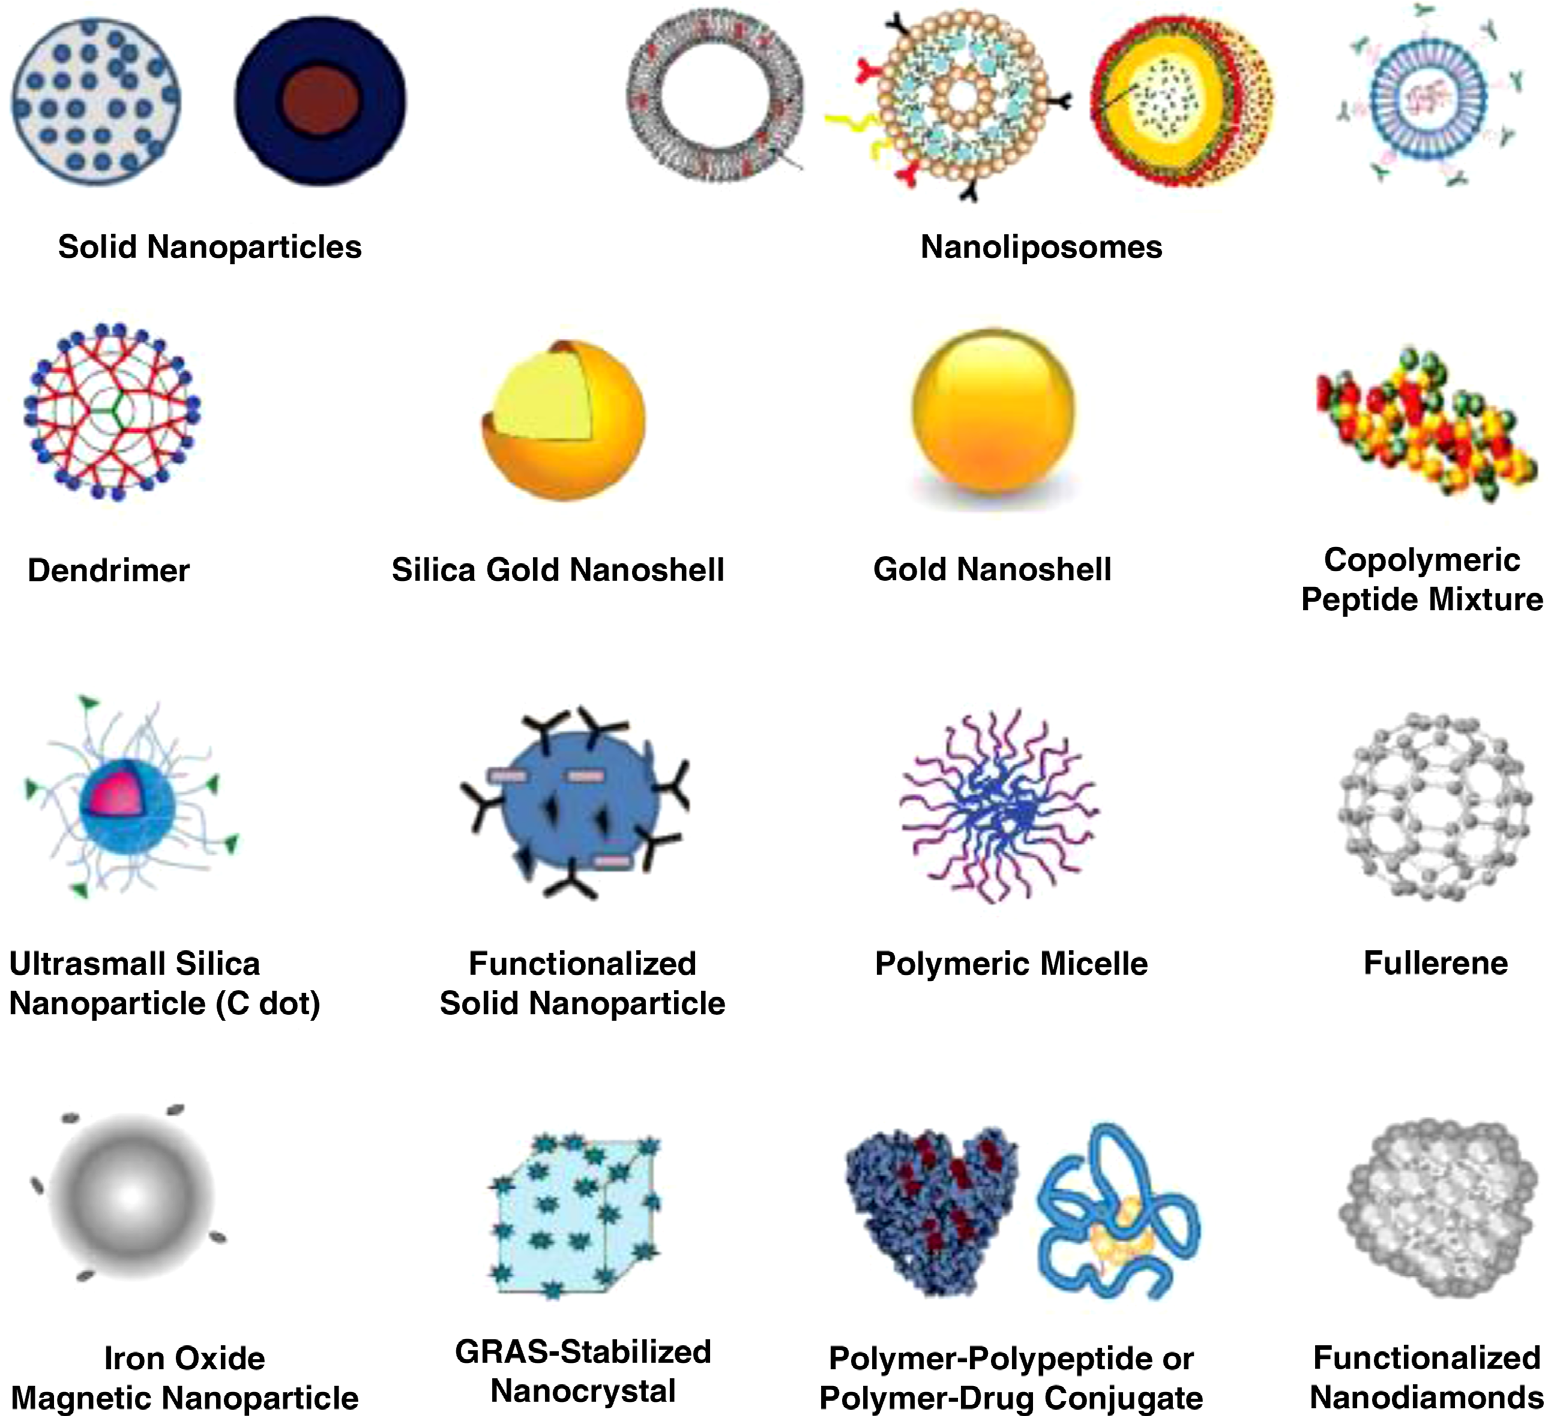
SCHEMATIC ILLUSTRATIONS OF NANOSCALE DRUG DELIVERY SYSTEM PLATFORMS (NANOTHERAPEUTICS OR NANODRUG PRODUCTS).
Shown are nanoparticles (NPs) used in drug delivery that are approved, in preclinical development, or in clinical trials. They are generally considered as first- or second-generation multifunctional engineered NPs, generally ranging in diameters from a few nanometers upto a micrometer. Active biotargeting is frequently achieved by conjugating ligands (antibodies, peptides, aptamers, folate, hyaluronic acid, etc.) tagged to the NP surface via spacers or linkers such as PEG or by altering the NP surface characteristics. NPs such as carbon nanotubes and quantum dots, although extensively advertised for drug delivery, are specifically excluded from the figure as this author considers them commercially unfeasible for drug delivery. Nonengineered antibodies and naturally occurring NPs are also excluded. Antibody – drug conjugates are encompassed by the cartoon labeled “polymer–polypeptide or polymer–drug conjugate.” This list of NPs is not meant to be exhaustive, the illustrations are not meant to reflect the three-dimensional shape or configuration, and the NPs are not drawn to scale. NPs: nanoparticles; PEG: polyethylene glycol; GRAS: generally recognized as safe; C dot: Cornell dot; ADCs: antibody–drug conjugates. Copyright © 2017 Raj Bawa. All rights reserved.
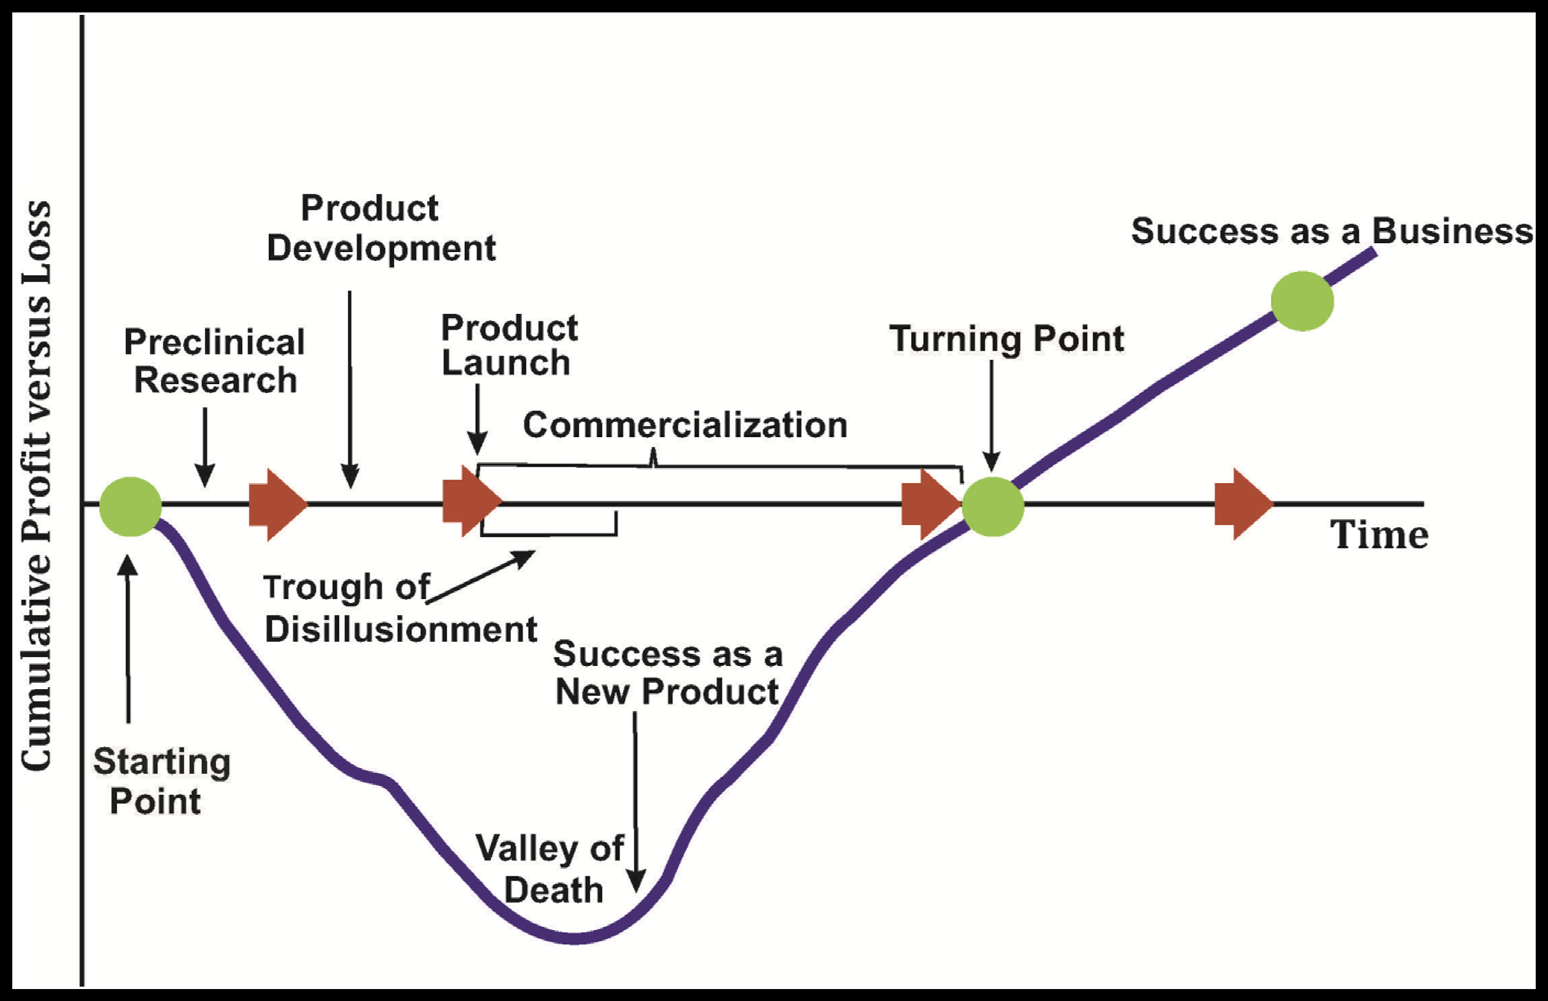
THE VALLEY OF DEATH IN COMMERCIALIZATION.
The valley of death represents the gap that exists between R&D breakthroughs made at the cellular and molecular biology levels on one end and the static levels of new treatments, diagnostics, and preventative tools reaching the market on the other. This is the time when ideas and inventions must undergo technical feasibility review, manufacturing optimization, market demand evaluation, reduction in production costs, and commercialization potential studies. This is when prior to market entry decisions are made whether to proceed or terminate product development. The upstream side of the valley of death (the science side) represents basic research inherently fraught with uncertainty, while downstream (the business side) represents the more regimented process of product development characterized by manufacturing, marketing, deliverables, deadlines, and budgets. Commercialization is about the translation crossing these two distinct paradigms. Copyright © 2017 Raj Bawa. All rights reserved.
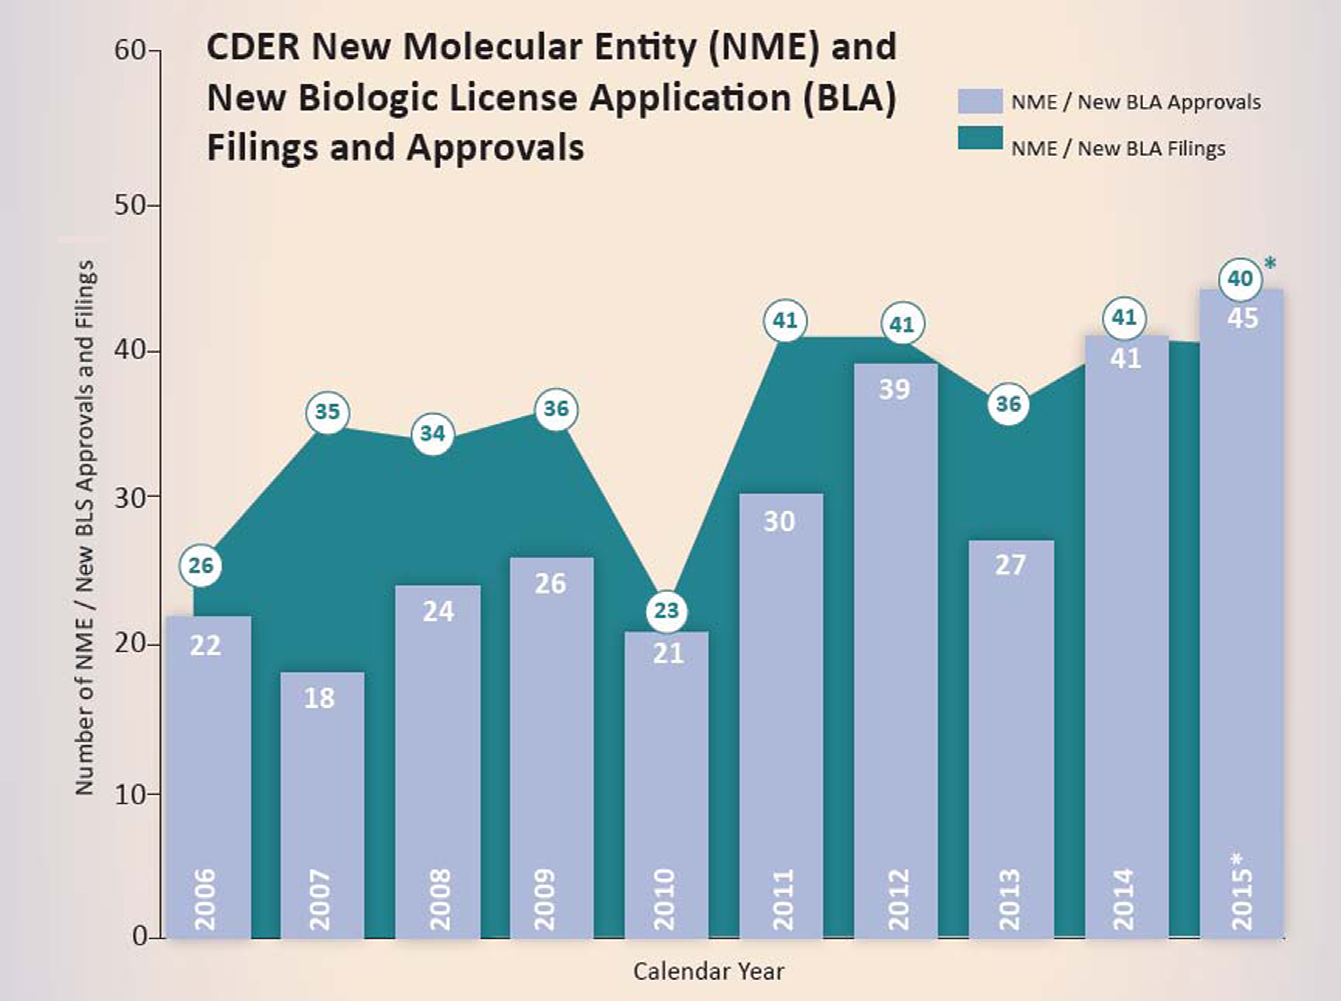
TEN-YEAR HISTORIC COMPARISON OF DRUG APPROVALS BY FDA’S CENTER FOR DRUG EVALUATION AND RESEARCH (CDER).
This figure represents, New Molecular Entity (NME) and New Biologic License Application (BLA) filings and, approvals in each calendar year starting from, 2006 until 2015. New drugs approved by the, FDA have risen sharply in recent years with the 2015 bounty being the most productive since 1996. However, in 2015, big innovations were in short supply, rejection letters issued by the FDA were surprisingly down, and few drugs stood out as breakthroughs. In fact, many products were more known for their breathtaking price tags and rapidity of FDA approval. The vertical bars indicate the number of New Drug Applications (NDAs) for NMEs approved by CDER from 2006 to 2015. The circled numbers indicate the number of NDAs for NMEs plus BLAs for new therapeutic biologics received by CDER for approval from 2006 until 2015. From 2006 through 2014, CDER has averaged about 28 novel drug approvals per year. CDER approved 45 novel drugs in 2015 (NMEs and new BLAs combined), up from the previous recent record of 41 drugs approved in 2014. Of these, 16 (36%) represented first-in-class designated drugs, 14 (31%) were cancer drugs, about 30% were biologics, 21 (47%) were orphan-designated drugs for rare diseases, and 16 were drugs with a novel mechanism of action.